In this section, the best explainable visualisations to verify the system’s status are displayed. Anomalies are deviations or irregularities in data patterns that stand out from the expected or normal behavior. So it is fundamental to assess and ensure the proper functioning, performance, and integrity of a system.
Confusion Matrix
Description
Example from XMANAI
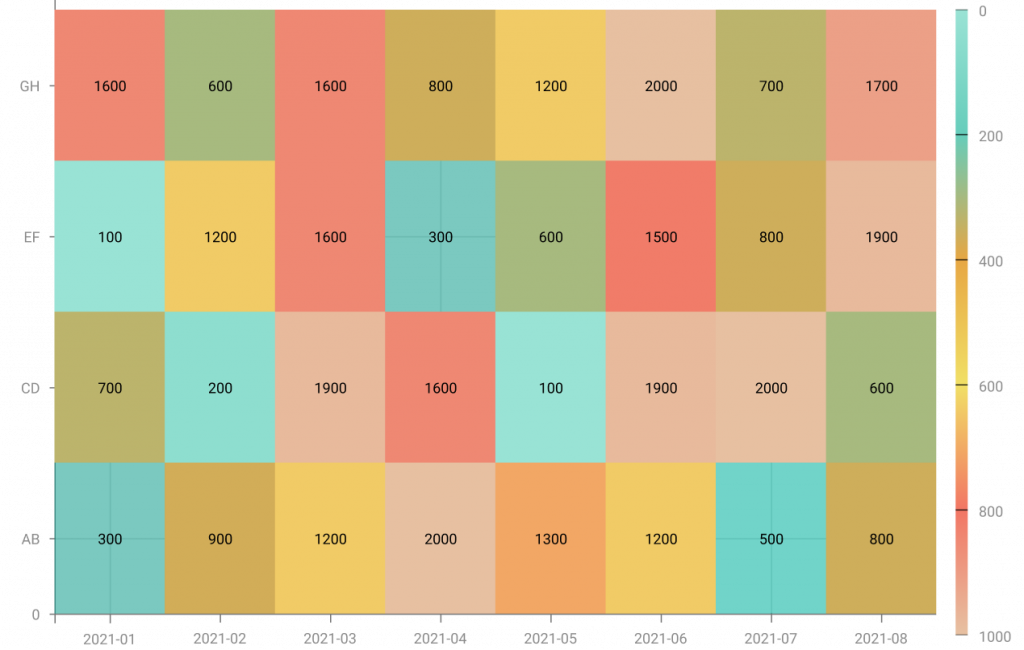
A confusion matrix is an N x N matrix used for evaluating the performance of a classification model. It summarizes the counts of true positive, true negative, false positive, and false negative predictions. It compares actual target values with those predicted by the machine learning model, providing insights into accuracy and error rates. It is particularly useful for assessing model performance in various scenarios, such as imbalanced datasets, error analysis, adjusting thresholds, and multiclass classification.
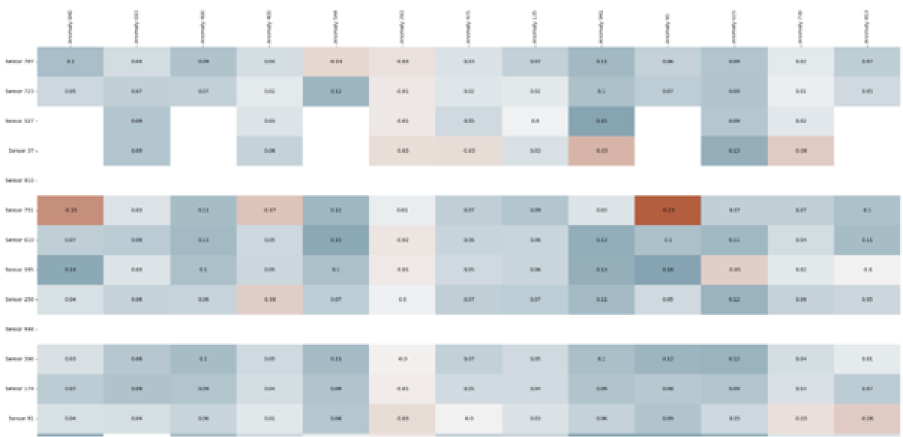
This confusion matrix has been used by a XMANAI demonstrator to provides a visualization helping workers gain insights into the correlation between a machine anomalies and the sensors associated to them. Anomalies are categorized and compared to sensor values, with colors indicating the strength of correlation: red for high correlation and blue for low correlation.
The XMANAI website uses cookies. By using our website and agreeing to this policy, you consent to our use of cookies in accordance with the terms of this policy.
This website uses cookies to improve your experience while you navigate through the website. Out of these, the cookies that are categorized as necessary are stored on your browser as they are essential for the working of basic functionalities of the website. We also use third-party cookies that help us analyze and understand how you use this website. These cookies will be stored in your browser only with your consent. You also have the option to opt-out of these cookies. But opting out of some of these cookies may affect your browsing experience.
Necessary cookies are absolutely essential for the website to function properly. This category only includes cookies that ensures basic functionalities and security features of the website. These cookies do not store any personal information.
Any cookies that may not be particularly necessary for the website to function and is used specifically to collect user personal data via analytics, ads, other embedded contents are termed as non-necessary cookies. It is mandatory to procure user consent prior to running these cookies on your website.