In this section, the best explainable visualisations to manage anomalies are displayed. Anomalies are deviations or irregularities in data patterns that stand out from the expected or normal behavior. The objective of this section is to assist you in addressing these irregularities, facilitating a restoration of standard operating conditions.
Images
Description
Example from XMANAI
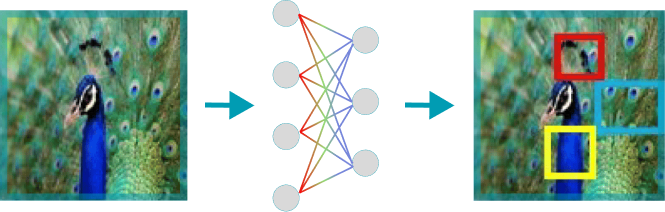
Images refer to a graphical representation such as picture, map or diagram that synthesizes and highlights complex information in an understandable manner. Images are often used to effectively communicate data, allowing people to identify patterns, trends, or key points more intuitively than a tabular representation of data.
One XMANAI demonstrator used an image to depict in a comprehensible way which are the most influential features and how they affect the sales prediction (increasing/decreasing the sales predictions).
The XMANAI website uses cookies. By using our website and agreeing to this policy, you consent to our use of cookies in accordance with the terms of this policy.
This website uses cookies to improve your experience while you navigate through the website. Out of these, the cookies that are categorized as necessary are stored on your browser as they are essential for the working of basic functionalities of the website. We also use third-party cookies that help us analyze and understand how you use this website. These cookies will be stored in your browser only with your consent. You also have the option to opt-out of these cookies. But opting out of some of these cookies may affect your browsing experience.
Necessary cookies are absolutely essential for the website to function properly. This category only includes cookies that ensures basic functionalities and security features of the website. These cookies do not store any personal information.
Any cookies that may not be particularly necessary for the website to function and is used specifically to collect user personal data via analytics, ads, other embedded contents are termed as non-necessary cookies. It is mandatory to procure user consent prior to running these cookies on your website.