What kind of specific trends and patterns emerge from data?
In this section, the best explainable visualisations to highlight emerging patterns and trends are displayed. Specifically, this section will help you to better interpret and use the extracted information.
Mixed
Description
Example from XMANAI
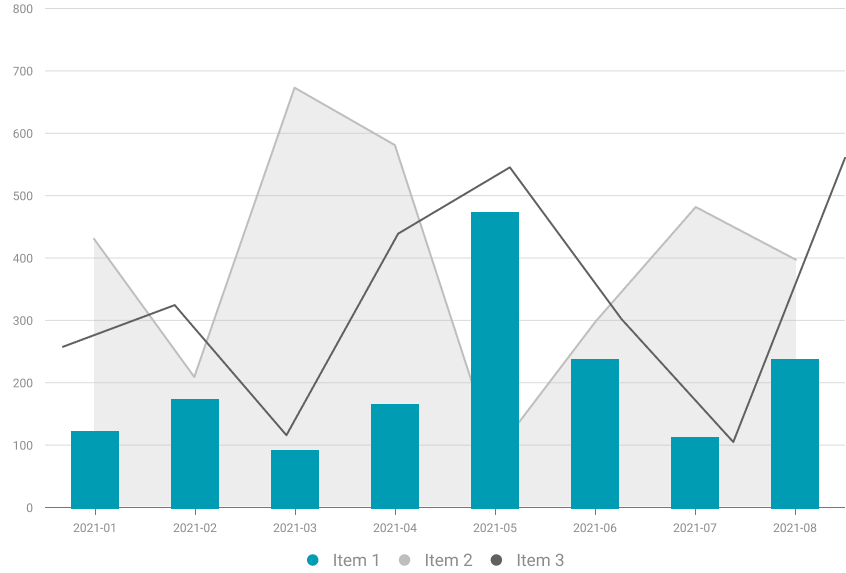
Mixed visualizations seamlessly combine various types of visualisations to offer users a comprehensive explanation. They prove particularly effective in presenting results and clarifying complex systems that involve diverse models and data, combining their outcomes for a cohesive understanding.
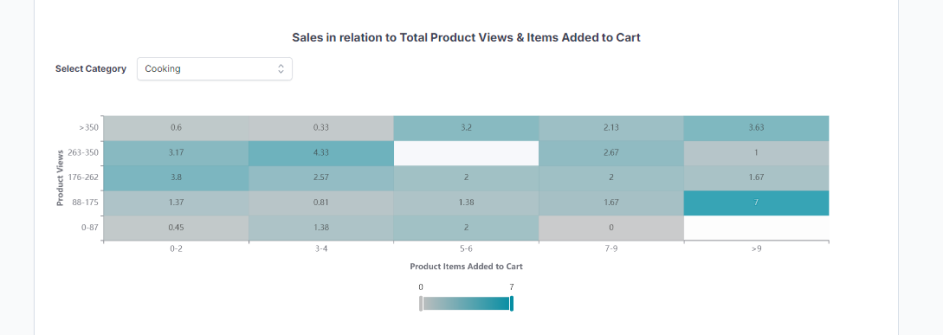
A mixed chart is employed by a XMANAI demostrator to illustrate the relationship between various data points. Specifically, it maps the quantity of items added to the online shopping cart along the x-axis, and the number of views on the company’s e-commerce website for a particular product category along the y-axis.
The XMANAI website uses cookies. By using our website and agreeing to this policy, you consent to our use of cookies in accordance with the terms of this policy.
This website uses cookies to improve your experience while you navigate through the website. Out of these, the cookies that are categorized as necessary are stored on your browser as they are essential for the working of basic functionalities of the website. We also use third-party cookies that help us analyze and understand how you use this website. These cookies will be stored in your browser only with your consent. You also have the option to opt-out of these cookies. But opting out of some of these cookies may affect your browsing experience.
Necessary cookies are absolutely essential for the website to function properly. This category only includes cookies that ensures basic functionalities and security features of the website. These cookies do not store any personal information.
Any cookies that may not be particularly necessary for the website to function and is used specifically to collect user personal data via analytics, ads, other embedded contents are termed as non-necessary cookies. It is mandatory to procure user consent prior to running these cookies on your website.