What would be the outcome if some features are changed?
In this section, the best explainable visualisations to underline the impact of altering specific features are displayed. Specifically, this section will show you how to indicate how the outcame would change with different features.
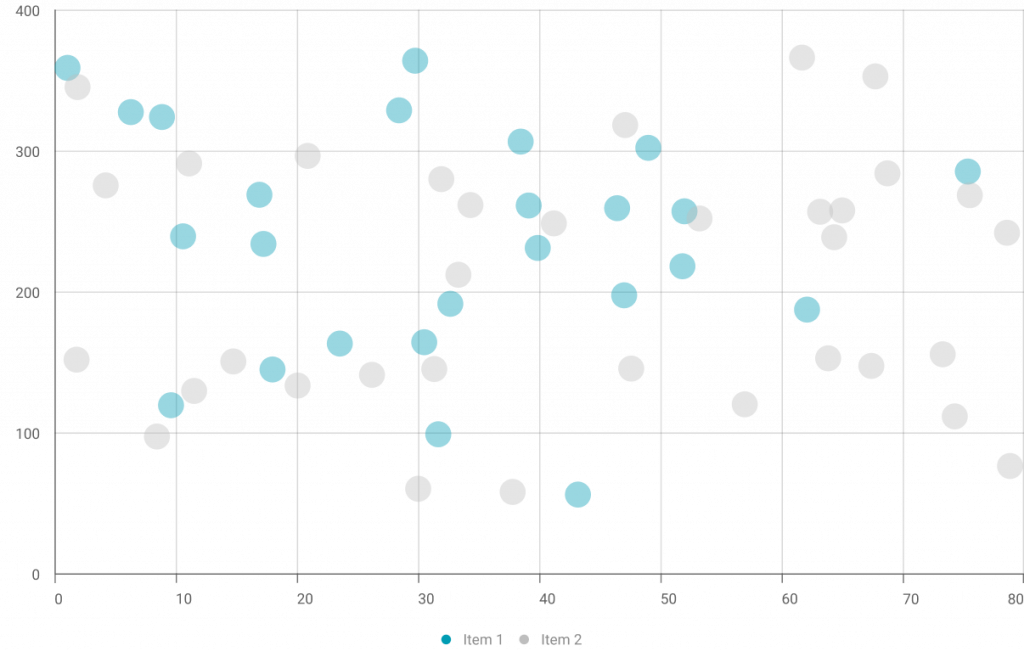
Scatterplot
Description
A scatterplot is a visual representation of data points on a two-dimensional plane, with each point indicating the values of two variables. It is used to identify relationships, trends or patterns between the variables, making it a visual way to assess the strength and direction of the relationship between variables and a valuable tool for exploring correlations and outliers in datasets.
The XMANAI website uses cookies. By using our website and agreeing to this policy, you consent to our use of cookies in accordance with the terms of this policy.
This website uses cookies to improve your experience while you navigate through the website. Out of these, the cookies that are categorized as necessary are stored on your browser as they are essential for the working of basic functionalities of the website. We also use third-party cookies that help us analyze and understand how you use this website. These cookies will be stored in your browser only with your consent. You also have the option to opt-out of these cookies. But opting out of some of these cookies may affect your browsing experience.
Necessary cookies are absolutely essential for the website to function properly. This category only includes cookies that ensures basic functionalities and security features of the website. These cookies do not store any personal information.
Any cookies that may not be particularly necessary for the website to function and is used specifically to collect user personal data via analytics, ads, other embedded contents are termed as non-necessary cookies. It is mandatory to procure user consent prior to running these cookies on your website.